Microsoft Power BI
Microsoft Power BI is a Cloud Based, Self-Serviced, Business Intelligence and Data Visualization Software from Microsoft Corporation. Microsoft Power BI can Server your end to end Business Intelligence Needs starting from Data Preparation, Data Modeling, Data Visualizations, Managing and Sharing the Visualization or Reports.
Get Power BI Training In Hyderabad at AB Trainings.
Data Visualization
Presenting the information in the form of Graphs, Charts, Maps etc., we call it as Data Visualization.
Business Intelligence(BI)
Business Intelligence is a Process which converts Business Data into Actionable Information or Business Insights. Business Intelligence Process will help Organizations to make more informed decisions.
Power BI Suite of Software’s
Microsoft Power BI contains below Suite of Software’s to perform end to end BI Process. Let us look at each of them and their usage in Business Intelligence Process.
- Power BI Desktop
- Power BI Service
- Power BI Report Server
- Power BI Mobile
Power BI Desktop
Power BI Desktop is a development software in Power BI Suite of software’s which is used to Connect to, Clean, Model and Visualize Your Data. Power BI Desktop contains Multiple components internally to perform above activities.
Get Power BI Training In Hyderabad at AB Trainings.
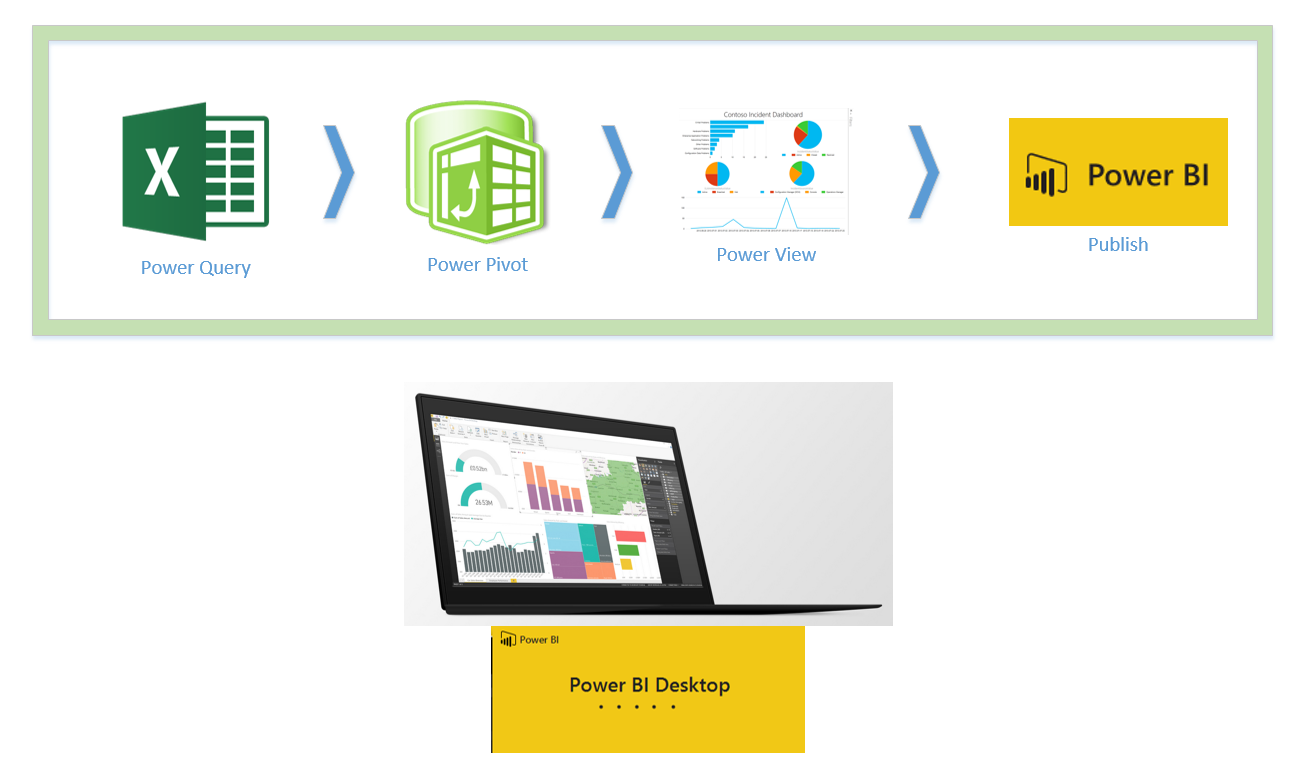
Components in Power BI Desktop
Power BI Desktop contains below components
- Power Query
- Power pivot
- Power View
Power Query
Power Query is used for Data Preparation in Power BI. The Power Query comes with a Graphical Tool called Query Editor and a formula language called M to transform the data. Power Query can load the result set into Power Pivot model.
Power Pivot
Power Pivot is an In-memory component in Power BI to store the transformed data. Power Pivot works on “xVelocity” In-Memory based tabular engine. The In-Memory engine gives Power Pivot super-fast response time. Modeling engine in Power Pivot would provide you a great place to build your Star Schema or Snow Flake Schema by establishing the relationships between Tables or Entities. To Create additional information for analysis in Power BI we use DAX (Data Analysis eXpression) Language. DAX is a powerful functional language which contains multiple functions that are helpful to create and Calculated Columns and Measures.
Get Power BI Training In Hyderabad at AB Trainings.
Power View
Power View is used for data Visualization in Power BI. With Power View you can create interactive charts, graphs, maps, and other visuals that bring your data to life. In Power BI you can Visualize the Data using hundreds of Visualization, in fact no other BI tool can have this many visualizations.
Flow of work in Power BI Desktop
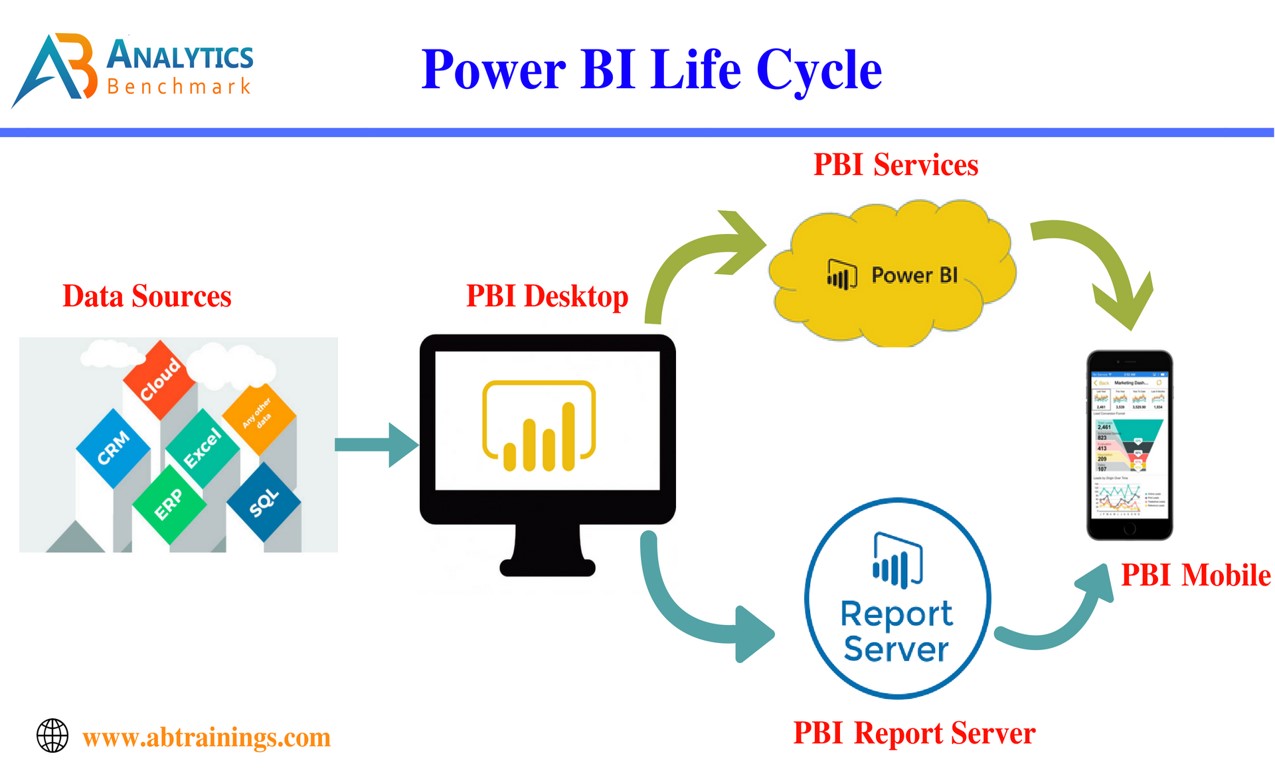
Power BI Service
Power BI Service is an Azure Cloud Based Server from Microsoft used for Managing and Sharing the Reports.
Power BI Report Server
Power BI Report Server is a solution or an On-Premise Server from Microsoft that customers deploy or install on their own On-Premises Servers for Managing and Sharing the Reports.
Power BI Mobile
Power BI Mobile is a Mobile Application which is used to view the Reports and Dashboards in Mobiles. Power BI Mobile App is available for Android, Apple, and Windows Phone, simply download it from Google Play (Android), or App Store (Apple), or Windows Store (Windows Phone) and install.
Flow of work in Power BI
Get Power BI Training In Hyderabad at AB Trainings.